Average Monthly Expenses: What the U.S. Data Shows
Average monthly expenses in the U.S. were about $6,545 in 2024. Compare category averages, see income-group differences, and check your own month.
By Ultimate Budget Planner by Cosmo Suite · Editorial policy
Published · 7 min read
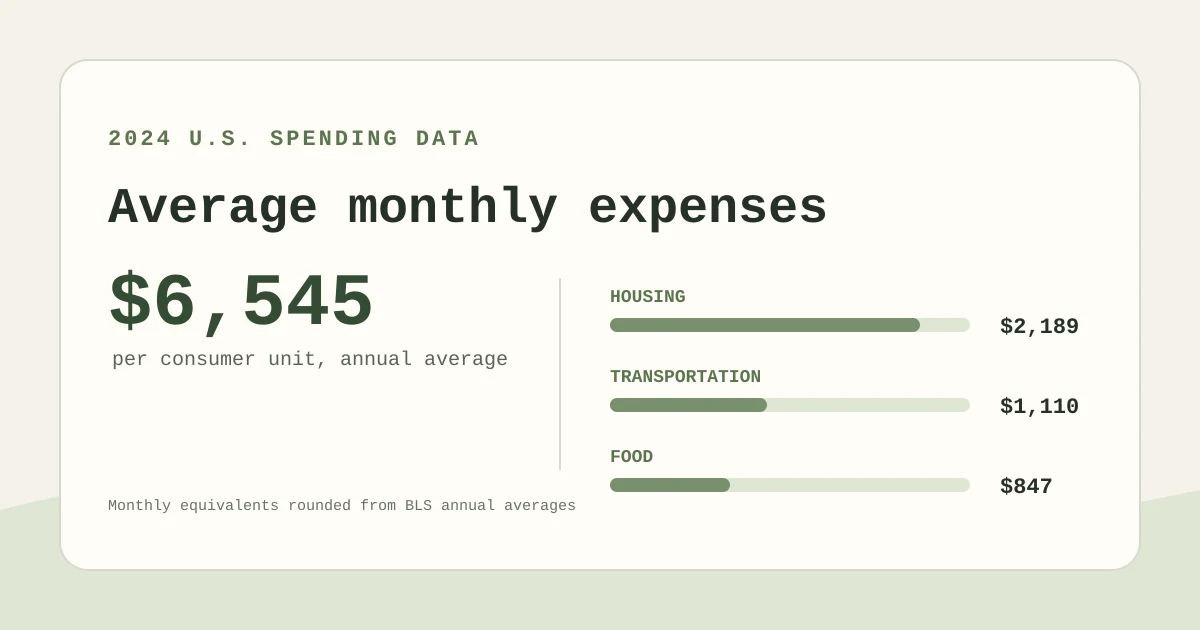
A search for average monthly expenses can leave you with one big number and a bigger question: does your own month look normal? The Bureau of Labor Statistics (BLS) says U.S. consumer units spent an average of $6,545 per month in 2024. That number cannot tell you what your rent, family size, or next paycheck will look like.
If you are paid every other week, a monthly average can also hide the dates when bills land. A budget needs to show the cash that arrives and the expenses that leave during the same period. Here is what the BLS number includes, how its categories break down, and a simple way to compare the data with your own month. A budget workbook that keeps monthly spending in one list can help make that comparison easier to maintain.
Key Takeaways
- BLS average annual expenditures were $78,535 per consumer unit in 2024, or about $6,545 per month.
- Housing, transportation, and food were the largest listed categories, at about $2,189, $1,110, and $847 per month.
- The averages describe a group across a year. They are not a target for your household or a statement about what a typical month costs.
- Compare your actual bills with cash received and due dates, especially when you are paid biweekly.
A national average cannot tell you what your month should cost
Average monthly expenses in BLS data are a reference point, not a personal budget target. In 2024, average annual spending was $78,535 per consumer unit. Divide that by 12 and the monthly equivalent is about $6,545.
Consumer unit is the BLS term for a family, a person living alone, or people living together who share major expenses. The BLS counted 2.4 people per consumer unit on average in 2024. That definition matters: the national mean blends different household sizes, incomes, locations, and housing situations.
The annual average also smooths months together. A household with car insurance twice a year or higher winter utility bills will not spend exactly the same amount every month. For people paid every other week, the number of paychecks can change too. Ten months usually have two paydays, while two months have three. A monthly equivalent cannot show when cash arrives or bills are due.
A comparison works best when the categories and time period match. If you want to record planned and actual amounts side by side, a budget spreadsheet for tracking monthly expenses gives you a starting layout. It helps to see what sits inside the national figure.
Average Monthly Expenses: The Decision Table
The BLS February 2026 summary of 2024 Consumer Expenditure data puts average expenditures at about $6,545 per month per consumer unit. The category amounts below are annual figures divided by 12 and rounded to the nearest dollar. They show how the national average is distributed, not what anyone should spend.
| Expense measure | 2024 annual average | Monthly equivalent |
|---|---|---|
| All expenditures | $78,535 | $6,545 |
| Housing | $26,266 | $2,189 |
| Transportation | $13,318 | $1,110 |
| Food | $10,169 | $847 |
| Healthcare | $6,197 | $516 |
| Personal insurance and pensions | $9,797 | $816 |
The BLS annual data tables also report total average spending by income quintile. The lowest-quintile consumer units averaged $35,046 for the year, or about $2,921 a month. The highest-quintile units averaged $150,342, or about $12,529 a month. These are averages for five income groups, not a range that describes every household. That spread makes the $6,545 figure a weak personal benchmark.
The Worked Month
Here is an illustrative month for one person paid $1,950 every two weeks. The month has two checks, $3,900 in take-home pay, $1,350 rent, and $520 for groceries. Those figures come from the site's documented example. The remaining amount is subtraction, not a complete estimate of monthly costs.
| Cash in | Example expenses | Cash remaining before other costs |
|---|---|---|
| $3,900 | $1,350 rent + $520 groceries | $2,030 |
The $2,030 still has to cover any transportation, utilities, insurance, healthcare, savings, and other spending in this example. Start with cash received and bills due. Averaging this pay schedule across the year gives $4,225 a month, but that is not a paycheck. Two months have a third check, which brings up the annual monthly average. That extra deposit does not arrive every month.
If rent is due before payday, mark that date beside the check that covers it. The guide to how much to spend on rent shows a separate timing check alongside rent-to-income comparisons.
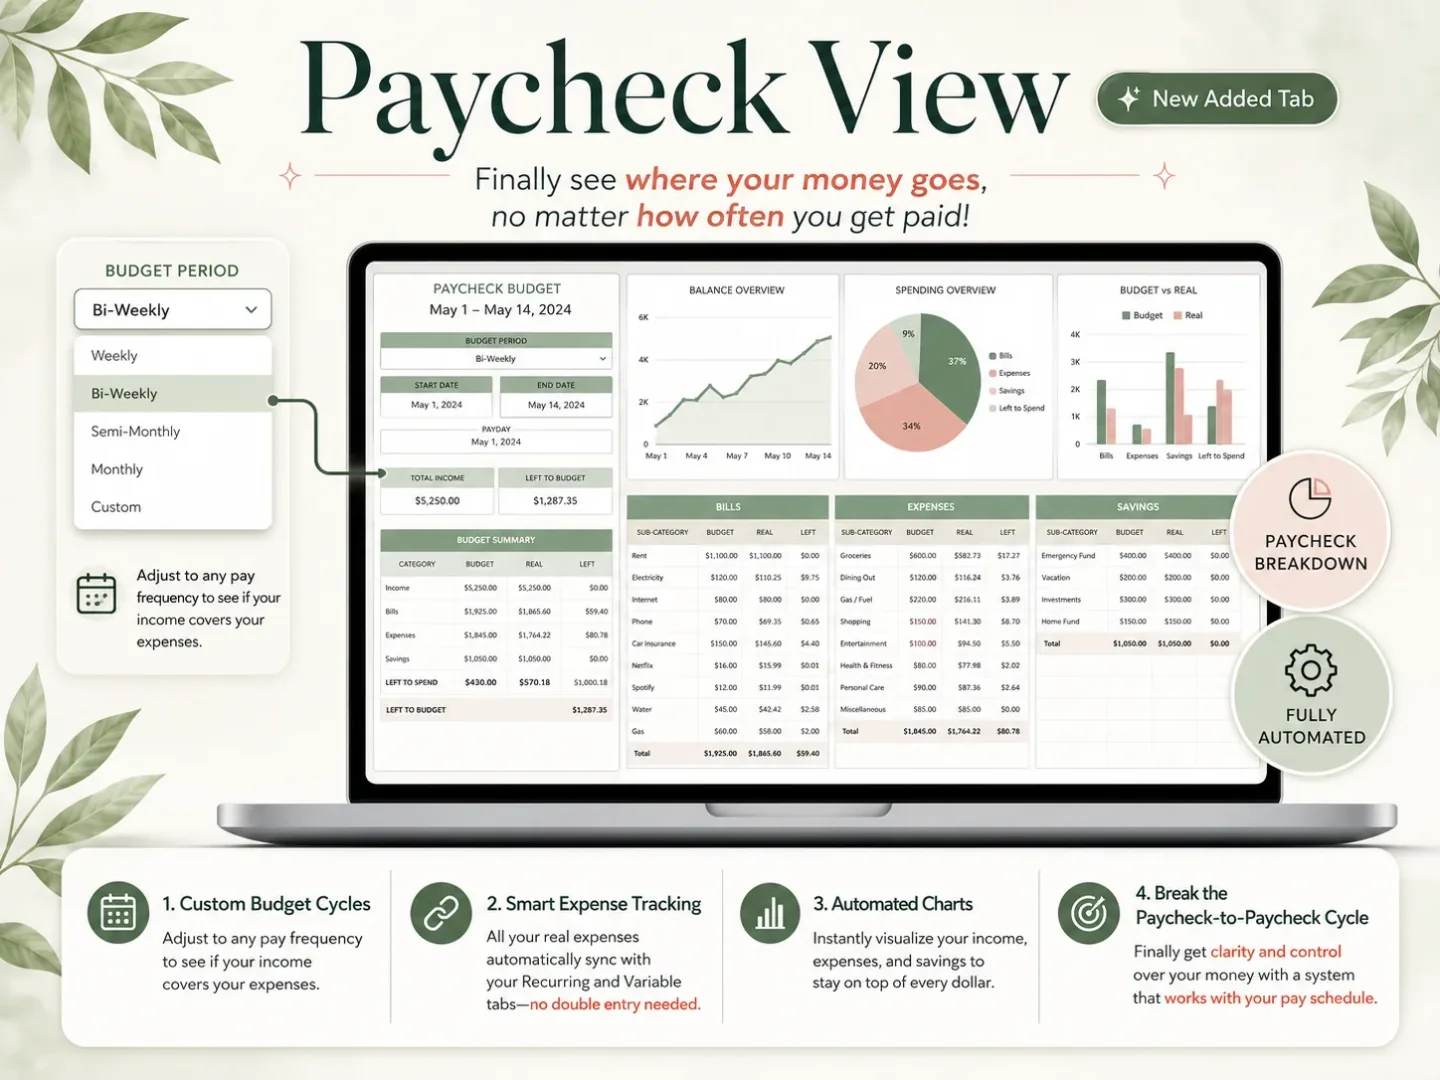
The paycheck view is a product screenshot. Its rows show how a planned budget can be organized by the deposit dates that fund it.
What the BLS average includes, and what it leaves out
BLS expenditure data cover what consumer units report spending during the year. Housing includes more than rent; it also covers owned dwellings, utilities, furnishings, and household operations. Transportation includes vehicle purchases and other vehicle costs, plus public transportation. Food includes both food at home and food away from home.
The $6,545 monthly equivalent therefore should not be read as a “typical bill” or as a monthly spending goal. It is a mean, so higher-spending consumer units pull it upward. It also combines people who own homes with renters and units of different sizes. BLS tables let readers look at averages by income, region, household size, age, and other characteristics, which may give a closer comparison than the all-unit mean.
The figures are nominal dollars reported for 2024. They do not adjust each household's bills for local prices or personal circumstances. A household with shared housing may spend less on housing than the mean. A family with children may have different food and healthcare costs than a person living alone. Neither difference by itself says that the household is doing something wrong.
For a more specific check, compare your own rent with the costs that come with it, such as utilities and parking, and keep the timing visible. The article on rent and paycheck timing walks through that comparison. The BLS's Consumer Expenditure Surveys tables provide published figures for additional demographic groups.
Turn the average into a useful comparison for your own month
Use the national benchmark as a prompt to compare categories in one of your own months. Start with your income and bills, then check what explains the difference. Use this as a record-keeping exercise. National shares are not targets for each category.
- Start with cash received. List each take-home deposit by date. If your schedule changes, use the checks that actually arrive in the month you are reviewing. The consumer.gov budgeting guide also starts with income and expenses.
- Gather the costs you paid. Use statements, receipts, and bills. The CFPB's Your Money, Your Goals toolkit includes a spending tracker for recording expenses.
- Group expenses consistently. Put rent and utilities under housing, and keep food at home separate from restaurant or takeout spending if that helps you compare with BLS categories. Leave room for costs that do not fit neatly in a broad category.
- Mark irregular bills. An annual renewal or a twice-yearly premium may not appear in a single month. Keep its due date and full amount visible. You can divide it by 12 for a monthly comparison, while still planning for the actual payment date.
- Compare planned and actual amounts. Review what you expected to spend and what left your account. If a category differs from the national figure, ask what explains it before changing your budget. A higher rent in one city may explain more than a small change to several flexible categories.
For example, a BLS average of $847 per month for food combines groceries and meals prepared away from home. If you spent $640 on groceries and $190 on restaurants, your total is $830. That is close to the national average, but it does not say whether the mix suits your household or whether the next month's plan should be different. The grocery budget guide explains how to build that line from your own spending.
Record bill dates as well as totals so you can see when each payment clears. A budget spreadsheet with a transaction list can organize planned and actual totals, while a Google Sheets budget template shows how to set up a simpler version. Both approaches depend on keeping the entries current.
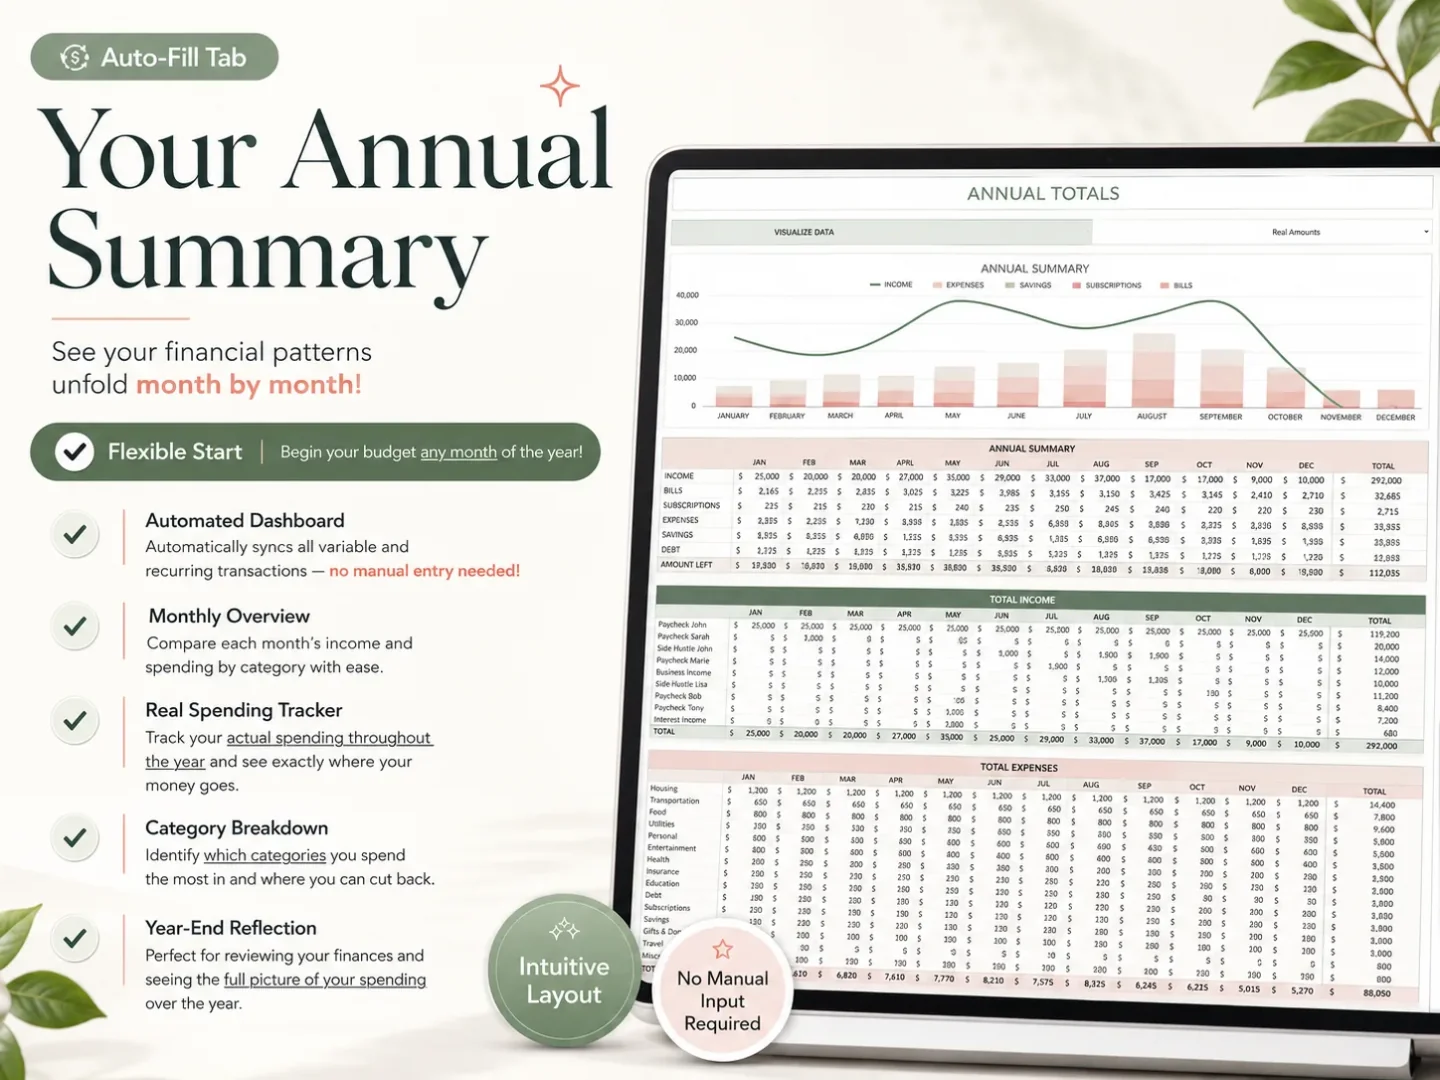
The annual summary is another product screenshot. It gives a year-level view after transactions have been recorded.
Why Trust This Article
Cosmo Suite makes the Ultimate Budget Planner. The About page identifies the publisher, and the editorial policy explains how articles are reviewed and corrected. The spending figures come from the U.S. Bureau of Labor Statistics' Consumer Expenditure Surveys for 2024, published in its annual report and summarized in February 2026. The monthly amounts are annual values divided by 12 and rounded. The worked month uses documented example figures and is illustrative. This article explains budgeting mechanics and is not financial advice.
Where the Ultimate Budget Planner Fits
A spreadsheet can help when you want to compare categories, paydays, and bills in one file. Ultimate Budget Planner includes 28 tabs across four sections, with Excel and Google Sheets versions. Its monthly views and paycheck dashboard use a transaction list, and the file has no subscription.
You do have to enter or paste transactions yourself. A budgeting app may fit better if automatic bank syncing and phone entry matter most to you. If you prefer a spreadsheet, Ultimate Budget Planner's budget workbook gives you a ready-made layout for comparing planned and actual expenses. You can also build a free version with the Google Sheets layout guide.
After you record one month, compare its categories with BLS figures. Keep deposits and bill dates in view; they help explain why your total may differ.
Frequently asked questions
What are the average monthly expenses in the U.S.?
BLS puts 2024 average annual expenditures at $78,535 per consumer unit. Divide by 12 and the monthly equivalent is about $6,545. That mean is a reference, not a recommended amount for every household.
How does the BLS calculate average monthly expenses?
The BLS uses its Consumer Expenditure Surveys to collect annual spending data from consumer units. Divide an annual total by 12 to get a monthly equivalent. It does not mean each unit spent the same amount each month.
Are $1,000 a month enough for living expenses?
Whether $1,000 covers your living expenses depends on what you need to pay, where you live, and whether you share costs. List housing, utilities, food, transportation, healthcare, and other bills first. The BLS national mean provides context, not a personal threshold.
Are $2,000 a month enough to live on?
Whether $2,000 a month works depends on location, household size, housing, and which costs are already paid. List the bills it must cover, then compare them with your take-home pay and due dates. The national average cannot answer that for you.
What are the biggest monthly expense categories?
BLS lists housing, transportation, and food among the largest categories. Their 2024 averages were about $2,189, $1,110, and $847 a month per consumer unit. Your own totals may be different.
How can I compare my expenses with the national average?
Record a full month of bills and transactions. Put similar costs in the same categories, and keep annual bills separate until you divide them by 12. Then check whether paydays fall before the bills they need to cover.